Note
Click here to download the full example code
Tutorial
This example shows how saiph works.
import pandas as pd

import saiph
from saiph.visualization import plot_circle
Fit the model
df = pd.read_csv("../../../tests/fixtures/iris.csv")

coord, model = saiph.fit_transform(df, nf=5)
print(coord.head())
     Dim. 1    Dim. 2    Dim. 3    Dim. 4    Dim. 5
0 -2.643907 -0.603966 -0.062524  0.123714  0.023531
1 -2.467082  0.160855  0.760712  0.380099 -0.121408
2 -2.715591 -0.064140  0.572116  0.034530 -0.040782
3 -2.654857  0.102214  0.759613  0.026693 -0.025427
4 -2.753830 -0.717357 -0.158470 -0.050660  0.072761
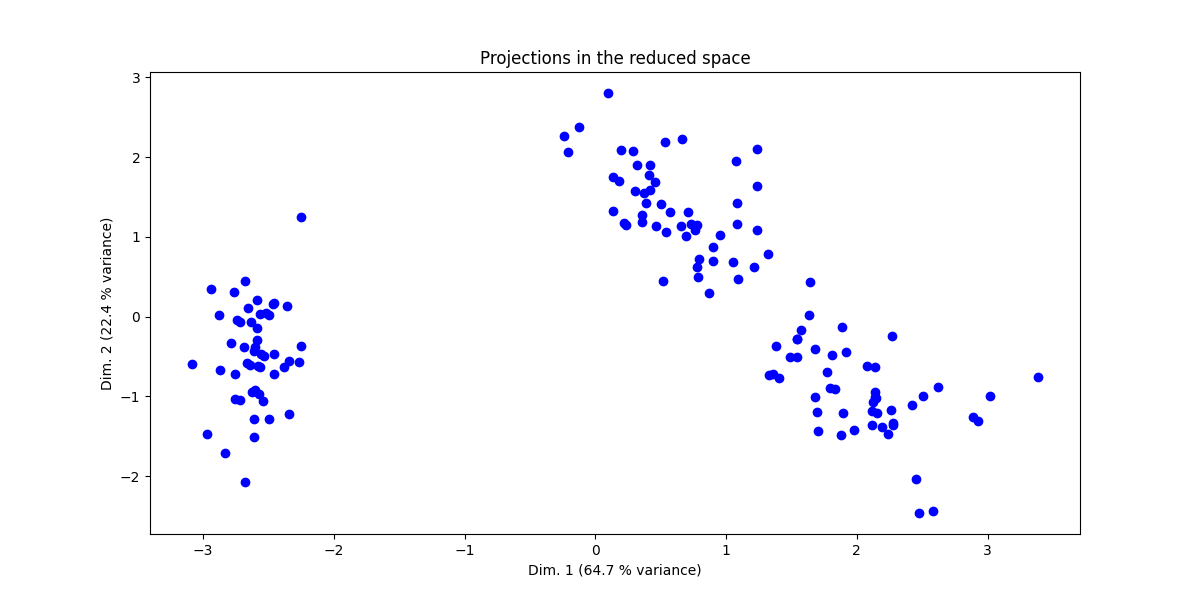
Project individuals
saiph.visualization.plot_projections(model, df, (0, 1))
Get statistics about the projection
model = saiph.stats(model, df)
print(model.cos2)
                Dim. 1    Dim. 2        Dim. 3        Dim. 4        Dim. 5
sepal.length  0.558969  0.005336  9.419276e-03  6.589394e-03  1.118242e-07
sepal.width   0.055004  0.258351  5.514559e-02  4.731168e-04  3.677468e-07
petal.length  0.968523  0.000002  3.960561e-06  2.223127e-07  4.835432e-06
petal.width   0.882583  0.000174  7.936563e-10  1.106446e-03  1.948436e-04
variety       0.465027  0.278545  3.323229e-02  1.535270e-04  4.003553e-05
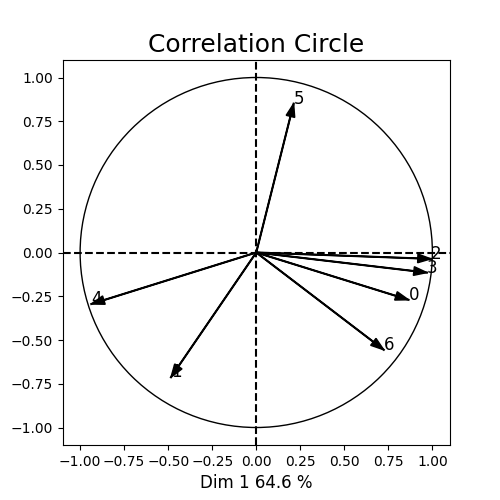
Correlation circle
plot_circle(model=model)
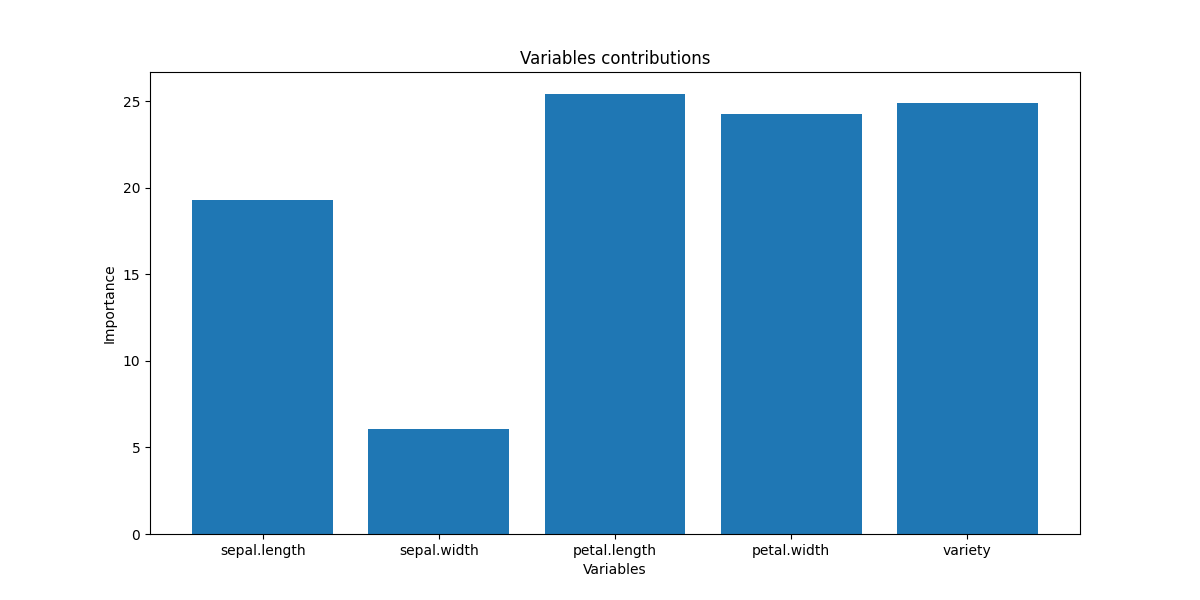
Variable contributions
print(model.contributions)
                 Dim. 1     Dim. 2     Dim. 3     Dim. 4     Dim. 5
sepal.length  19.318137   5.442424  16.402147  52.632696   1.256580
sepal.width    6.059927  37.868647  39.686917  14.103181   2.278750
petal.length  25.428824   0.098688   0.336334   0.305714   8.263041
petal.width   24.274426   0.982162   0.004761  21.567410  52.452391
variety       24.918686  55.608080  43.569841  11.391000  35.749238
saiph.visualization.plot_var_contribution(
    model.contributions["Dim. 1"].to_numpy(), model.contributions.index.to_numpy()
)
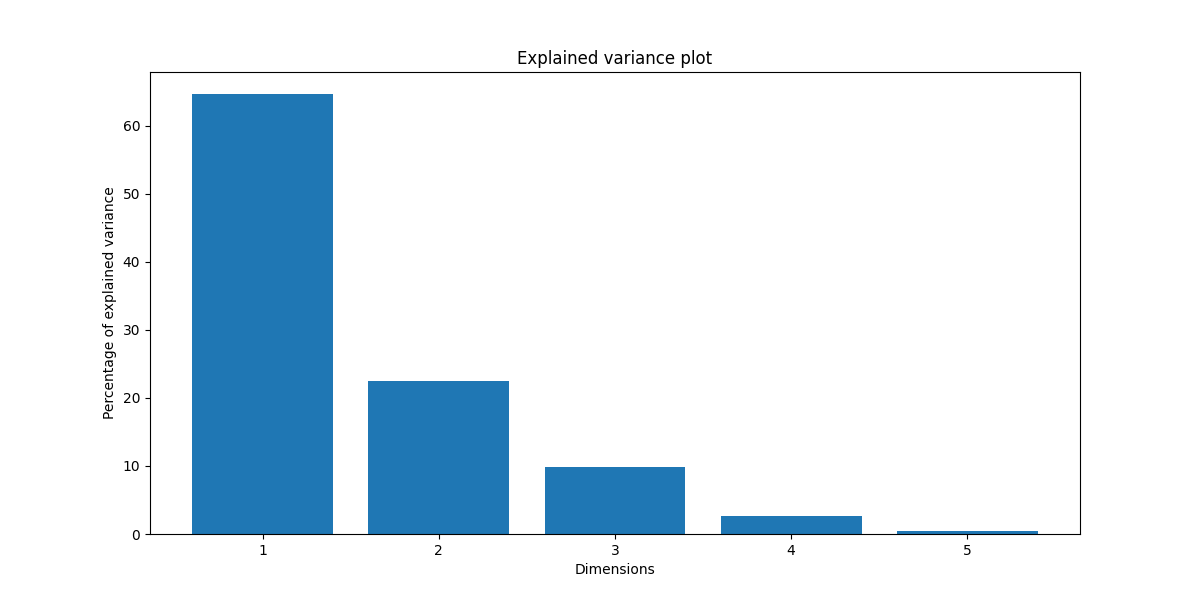
Explained variance
print(model.explained_var)
[1.73161455e-04 6.00547784e-05 2.64746674e-05 6.90060129e-06
 1.18971992e-06]
print(model.explained_var_ratio)
[0.64665272 0.22426807 0.09886678 0.02576955 0.00444288]
saiph.visualization.plot_explained_var(model)
Total running time of the script: ( 0 minutes 1.475 seconds)